

Have you ever needed to illustrate your company’s hierarchy or structure in a clear way that is visually appealing? Crafting an organisational chart is your solution. These charts provide a snapshot of how roles and responsibilities align within a company.
Here, you will learn about the importance of organisational charts and how you can effortlessly create one using Microsoft Word.
Organisational charts are not just static visual, they are representations that help in understanding reporting relationships, streamlining communication channels, and displaying transparency within a company. Using Microsoft Word’s intuitive features, you can customise layouts, colours and styles to suit your needs. Read on to explore how easy it is.
The Importance of an Organisational Chart
Organisational is. As mentioned above, an organisational chart is a vital tool for clearly visualising the structure of a business. It shows reporting relationships, levels of authortiy, and the way different roles connect which helps employees understand their responsibilities and where they fit within the organisation. This clarity reduces confusion, improves communication and supports smoother workflows as everyone knows who to approach for guidance, decision-making, or collaboration.
Beyond daily operations, an organisational chart also plays a key role in strategic planning. It highlights gaps, overlaps, or inefficiencies in staffing, making it easier for managers to plan for growth, restructure teams, or allocate resources more effectively.
By providing a clear snapshot of the organisation at any point of time, the chart becomes not just a reference tool but also a foundation for future planning and development.
Getting Started – Accessing SmartArt
The first step in creating an organisational chart is accessing SmartArt within Word. SmartArt graphics offer a range of layouts tailored for different types of charts.
Inserting SmartArt
Follow these steps to insert SmartArt graphics into your Word document:
- Place your cursor in the document where you wish to add the SmartArt graphic.
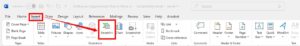
- Go to the ‘Insert’ tab on the top toolbar ribbon.
- Click on the ‘SmartArt’ button located within the Illustrations group. This will open a pop-up window with various SmartArt graphic options.
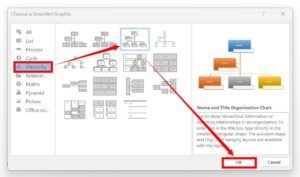
- Within the SmartArt gallery, locate the ‘Hierarchy’ category or search for Organisation Chart designs. Choose a layout that best suits your needs. Common options include hierarchical structures, grid organisations, or radial layouts.
- Once you select a layout, you can start typing directly into the SmartArt shapes to input names, positions, or other relevant information for each chart element.
Customising SmartArt for Your Organisational Chart
It’s important you tailor your organisational chart to accurately represent your company. When you click on your graphic, a SmartArt Design tab and a SmartArt Format tab will appear, allowing you to make adjustments.


Here are some ways you can customise SmartArt elements:
Shape Formatting
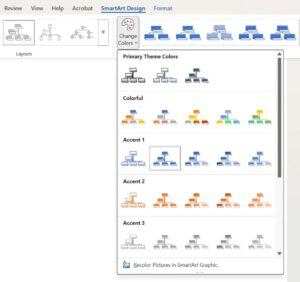
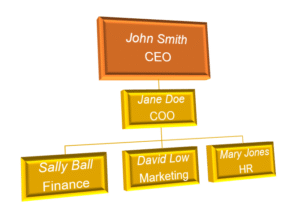
Modify the colours, borders, and effects of individual shapes within the SmartArt to differentiate levels or departments visually. You can even change the shapes to whatever you desire.
How to change shapes:
- Select the shape you want to change by clicking directly on it.
- Go to the SmartArt Tools → Format tab.
- In the Shapes group, click ‘Change Shape’.
- Choose your preferred shape (e.g., rectangle, rounded rectangle, oval) from the dropdown list.
- The selected shape will update instantly while keeping the text and position in the chart.
Quick tip: If you want to apply the same shape style to multiple boxes, hold the ctrl button while selecting them, then use ‘Change Shape’ once so they match.
Layout Adjustments
Explore the SmartArt Design tab and SmartArt Format tab and experiment with different layouts to find the most informative and visually appealing representation. This can include angular and 3D designs.
Adding Images
Personalise your organisational chart by incorporating images or icons to represent team members or specific roles. This can enhance engagement and clarity.
By using customisation options, you can create an organisational chart that effectively communicates your company’s structure while keeping in-line with your business brand. For further insights on accessing SmartArt in Word for your organisational chart, refer to Microsoft’s guide on Where are the SmartArt tools?.
Adding Text and Shapes to Your Organisational Chart
When creating an organisational chart in Microsoft Word, it’s important to add texts and shapes to clearly represent the different positions and hierarchy levels. Here’s how you can easily handle text and shapes within your chart:
Editing Text
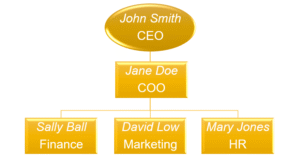
Simply click on the shape containing the text you wish to modify. Once selected, you can directly type within the shape to edit the existing text or add new information. Use the formatting options to adjust the font size, style, colour, and alignment for clarity and consistency.
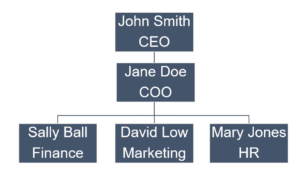
Adding and formatting text within the shapes enables you to label various positions, departments, or individuals accurately. This method provides a structured visual representation of the business hierarchy, making it easier for people to understand the roles/relationships within the chart at a quick glance.
Adding Shapes/New Positions
Sometimes you may need to add positions or levels to your organisational hierarchy, and incorporating new shapes allows you to expand the chart to reflect updated information, changes in structure, or potential growth. Maintaining an accurate, adaptable chart ensures it can easily adjust to organisational changes.
Below are 2 methods to add new positions to your chart:
METHOD 1
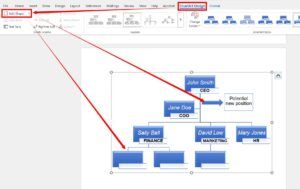
- Select the chart, click the box closest to where you want the new one.
- Go to the SmartArt Design tab → Create Graphic group → Press the ‘Add Shape ▼’ button, then pick from the drop-down list:
- Add Shape Below – for a subordinate
- Add Shape After/Before – for a coworker of the same level
- Add Shape Above – for a manager
- Add Assistant – for an assistant role
- Type to label the new box.
METHOD 2
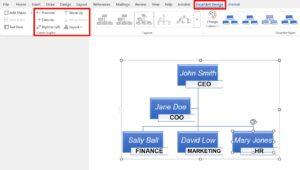
- SmartArt Design TAB → Press the ‘Text Pane’ button.
-
- Press Enter to add a coworker
- Press Tab to make it a subordinate
- Press Shift+Tab to promote to a higher level
If ‘Add Shape’ is greyed out, click inside the SmartArt first (ungrouped shapes can’t use Add Shape).
Moving Shapes/Positions
If position hierarchies change, you can use the ‘promote’ or ‘demote’ buttons or the general move buttons to shift the positions around the chart. Just click on the box you want to move and use the desired direction button.
Using texts and shapes ensures the structure remains consistent and effectively communicates the roles and responsibilities within the organisation.
Finalising Your Organisational Chart
When finalising your organisational chart, start by fine-tuning the layout to ensure the hierarchy of positions is accurate, moving shapes as needed to reflect the correct structure. If necessary, use colours or shapes to clearly distinguish between different levels or departments. Finally, customise the style by experimenting with Word’s design options, choosing one that aligns with your organisation’s branding and presents a professional aesthetic.
Once you are satisfied with the final look of your organisational chart, it’s crucial to save your document to preserve your work. You can then access the organisational chart at any time for reference, sharing, or further editing. Each time you update it, use the ‘Save As’ function and save it under a new version number.
Example: If your original document is labelled ‘Organisational Chart V1.0’ you can save the updated document as ‘Organisational Chart V1.1’
Note: Some companies prefer label version control as V1, V2, V3 etc. Others prefer a system of using V1.0, V1.1, V1.2 for small edits, and V2 for large document changes (or final copies). Always check what your company’s version control rules are.
Get Creative with Your Organisational Chart
Creating an organisational chart in Microsoft Word is a breeze. The user-friendly features surpass the old days of having to manually draw boxes with arrows. By using SmartArt graphics, you can create your chart in minutes with easy drag-and-drop functions. By following these steps and using the formatting options, you can quickly produce a professional looking organisational chart to streamline communication within your teams. This is yet another invaluable tool that Microsoft has to offer to make your life easier!
Here are more helpful articles to produce a professional document: